.png)
Bitcoin is set to close the third quarter 42.5 percent above its $58,585 quarterly open. That puts it on course for its strongest quarter since the fourth quarter of 2024 and its second-strongest third quarter since 2013. The median Q3 return for bitcoin is 2.2 percent. Our base case is that price consolidates into quarter-end between the $83,000 long-term holder cluster and the $87,722 yearly open. That has largely played out, with BTC trading mostly below $84,000 so far this week.
Bitcoin is less than five percent below its 21 September high of $87,392, but the underlying market has changed considerably. Aggregated futures open interest (OI) is at its lowest since March, implied volatility (IV) sits close to a one-year low and Exchange Traded Fund (ETF) inflows have slowed to roughly match the pace of new bitcoin issuance. With leverage substantially reduced, the next sustained move will need to be led by the spot market. Today’s Intelligence Update examines what October has historically delivered, and what markets could deliver in the month ahead.
Deleveraged Futures Market Hands The Next Move To Spot Demand
Aggregate BTC futures OI, measured in bitcoin, has fallen from above 700,000 BTC on 21 September to 644,000 BTC on 29 September, its lowest reading since 4 January.
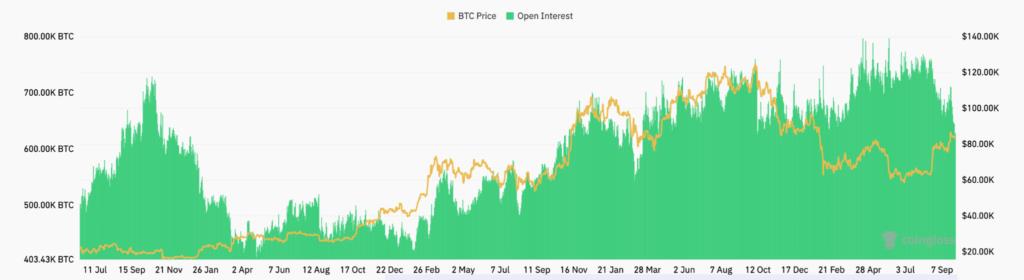
OI has historically respected support and resistance levels in the same way as price. The 700,000 BTC threshold has continually been a resistance level for open interest since the downtrend that began on 10 October, 2025. The seven-day decline for the metric now stands at 49,000 BTC, the largest weekly drop since October 2025. Every larger fall on record has coincided with forced liquidations.
OI on the Chicago Mercantile Exchange (CME) dropped by 16,075 BTC on Monday, 28 September, marking its third-largest daily contraction on record. The September futures contract expiration drove this shift. Exactly 15.79 percent of positions were carried into settlement, representing the largest share since June 2023. Diminishing basis yields account for most of the unwind. The October contract currently carries an annualised 5.1 percent premium, sharply compressed from the brief expansion logged when BTC saw a price spike on 21 September. At that level, basis traders have little incentive to roll exposure forward. Some holders of long positions also appear to have taken profit alongside this transition.
This combination of contracting OI in response to diminished futures premiums, has historically supported price action. Since 2022, elevated futures settlement ratios paired with compressed carry have preceded a median 30-day gain of 8.9 percent. If current basis rates persist and OI remains flat, the historical patterns suggest that bitcoin could continue to appreciate.
With the drop in OI, we have also seen a drop in liquidations. Since 23 September, which saw $438 million in long liquidations, there has been no similar scale of liquidation activity, indicating that traders have been closing contracts voluntarily to take profit. The same OI decline can also be read as fading demand. The failure of bitcoin-denominated OI to expand alongside price signals a lack of speculative appetite and persistent profit-taking. Both interpretations are correct as they describe different things. Low leverage limits the scope for a price decline to accelerate through liquidations, but it does not create a buyer. That buyer must come from the spot market.
New Cost Basis Below $84,000 Faces 1.39 Million BTC in Overhead Supply
The on-chain cost-basis distribution between $84,000 and $86,500 has thickened to 1.39 million BTC (see figure below). Part of this supply belongs to long-term holders who spent most of 2026 underwater. The rest belongs to buyers from the past 10 days, since price broke above the previous range high. Both groups are now marginally below their entry. Holders in that position tend to sell when price returns to their cost basis, which makes the $84,000 to $86,500 band likely a pivotal resistance level.
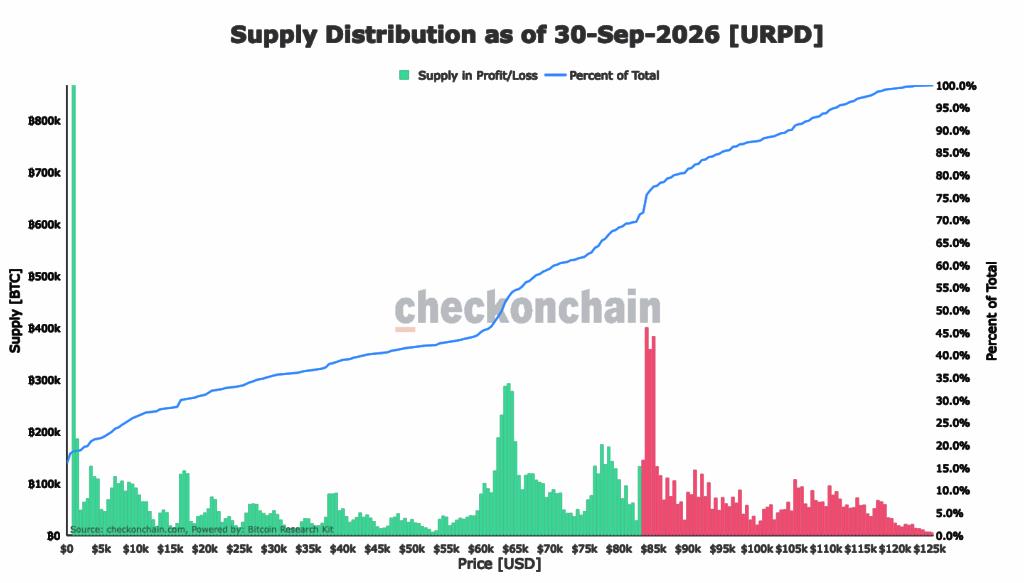
The more encouraging change is directly beneath it. The $82,500 to $84,000 band held about 110,000 BTC just on 27 September. By today (30 September), the same band holds 306,000 BTC. The coins came from both directions: holdings in the former $77,000 to $81,500 range fell by about 57,000 BTC as earlier buyers took profit, while the $85,000 to $86,500 band fell by about 49,000 BTC as recent buyers sold at a loss. Spot demand is therefore absorbing supply at current prices. Below this new band, the distribution thins to 121,000 BTC between $81,500 and $82,500, before reaching the 1.15 million BTC which sits at the $81,300 former range high.
The Supply in Profit metric shows why this matters for the cycle question, as we discussed in our 23 September Intelligence Update. Historically, whether this metric can remain above 75 percent when the market falls, has helped distinguish new bull markets from bear market recoveries. Supply in profit has fallen from 78.1 percent on 21 September to 71.3 percent on 29 September, taking it below that threshold, leaving the transition to a new bull market unconfirmed.
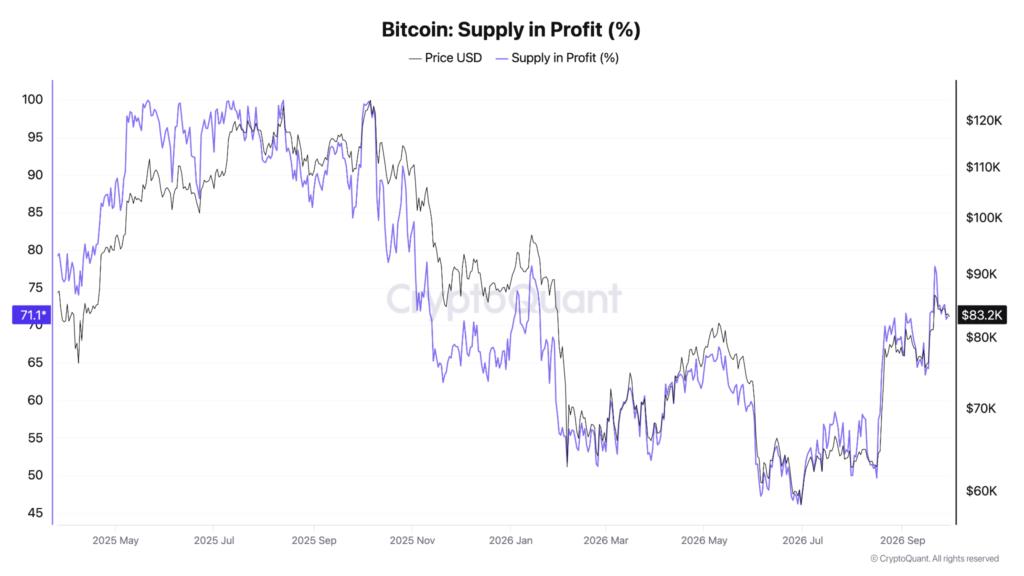
On the current distribution, a return above $85,000 would lift Supply in Profit above 75 percent.
Short-term holder supply, meaning coins held for under 155 days, still sits roughly 14 percent above its average cost basis of about $72,800. Realised profit remains a fraction of the levels seen at the 2024 and 2025 highs. This week’s trading therefore has delayed the transition to a bull market structure without reversing it.
We expect the current band to decide the next move. While the $82,500 to $84,000 cost basis keeps thickening, buyers are absorbing the coins that overhead holders sell, and each day of that dynamic reduces the supply waiting at breakeven. A reclaim of $85,000 would return the 760,000 BTC held between $84,000 and $85,000 to profit and lift supply in profit back above 75 percent. At that point, those holders stop being sellers.
Above $86,500, the entire 1.39 million BTC of overhead supply is in profit and the band becomes support. From there, only about 513,000 BTC is held between $86,500 and $90,000, leaving relatively little overhead supply to slow a move through the $87,722 yearly open. If $82,500 is lost instead, we expect price to move quickly through the thin zone to $81,300 former range high, where the 1.15 million BTC of that former range is the first level at which buyers have a cost basis to defend.
ETF Absorption Must Recover Before $84,000 Can Be Reclaimed
The BTC ETF complex has posted nine consecutive days of inflows totaling $3.08 billion, yet daily pace remains the key determinant for clearing overhead supply. To better understand this, we use the Bitfinex Absorption-to-Emission Ratio (BAER), a metric that divides the BTC bought by ETFs in a session by the roughly 450 BTC miners produce each day. The BAER read has compressed from 25.6x (when $999M of inflows were recorded) on 21 September to 1.8x on 29 September. Absorbing the 1.39M BTC breakeven supply (which sits between $84,000 and $86,500) requires the BAER to recover toward 5.0x (~$190 million/day).
On the BTC corporate treasury side, buying remained firmly above cost basis over the past week. Strategy acquired 1,665 BTC at an average price of $85,681, while Strive added 1,107 BTC at an average price of $85,396. Key structural support sits at $81,900 which is currently the aggregate breakeven for ETF complex holders. That level is just above the $81,300 former range high, and maintaining it is critical to preventing the cohort from re-entering unrealised losses.
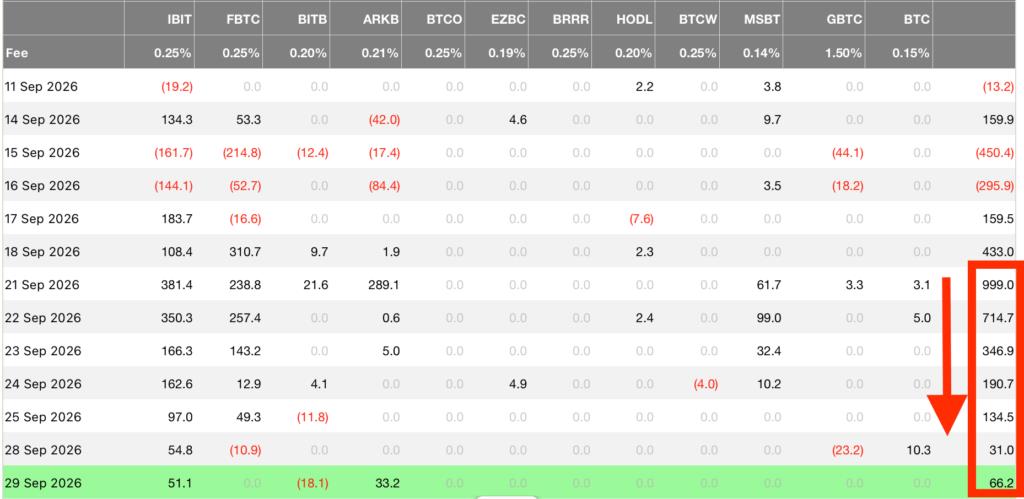
To summarise, robust ETF inflows and spot demand supported bitcoin prices throughout the week, absorbing selling from perpetual traders and profit-taking cohorts. However, that demand was not sufficient to sustain a move higher, with spot prices retreating towards the lower band of the established trading range.

Options Price a Quiet October, but History Suggests Otherwise
A drawdown normally lifts implied volatility (IV) due to holders hedging against price declines by paying higher premiums. Last week the opposite happened. BTC dropped 5.2 percent from $87,392 on 21 September to $82,865 on 24 September. The 30-day Implied Volatility Index closed at 34.6 on 25 September, lower than 98 percent of daily closes over the past year and within about a point of the 17 September one-year low of 33.6.
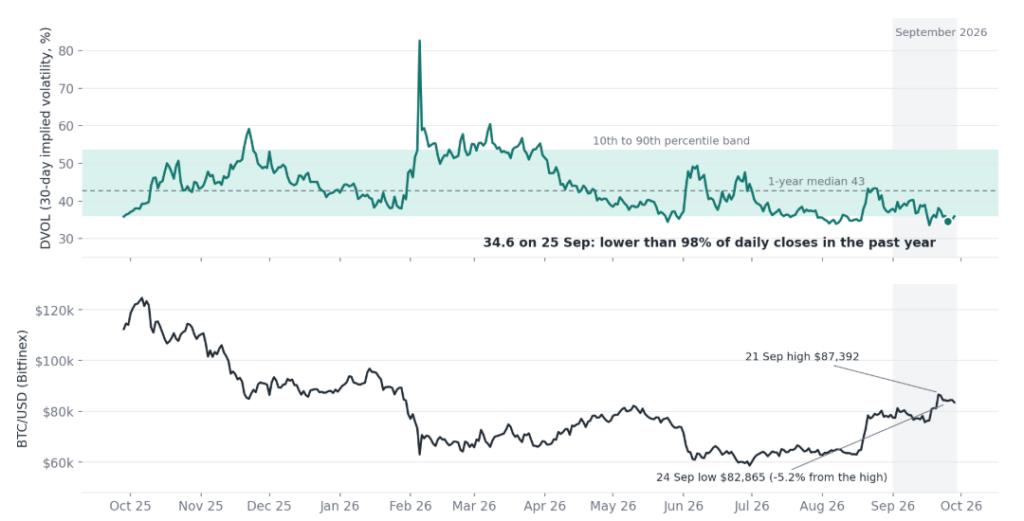
The size of that divergence is unusual. Over the past 12 months there were 15 pullbacks of five percent or more from a 10-day high. IV rose in all seven that exceeded 6.5 percent and fell in six of the other seven shallower ones, by up to 1.2 points. The 2.1-point fall between 21 and 24 September was the largest of the 15. IV is now also moving with price. The index rose 2.5 points on the 21 September rally and gave that back as price retreated, consistent with traders paying for upside exposure rather than protection.
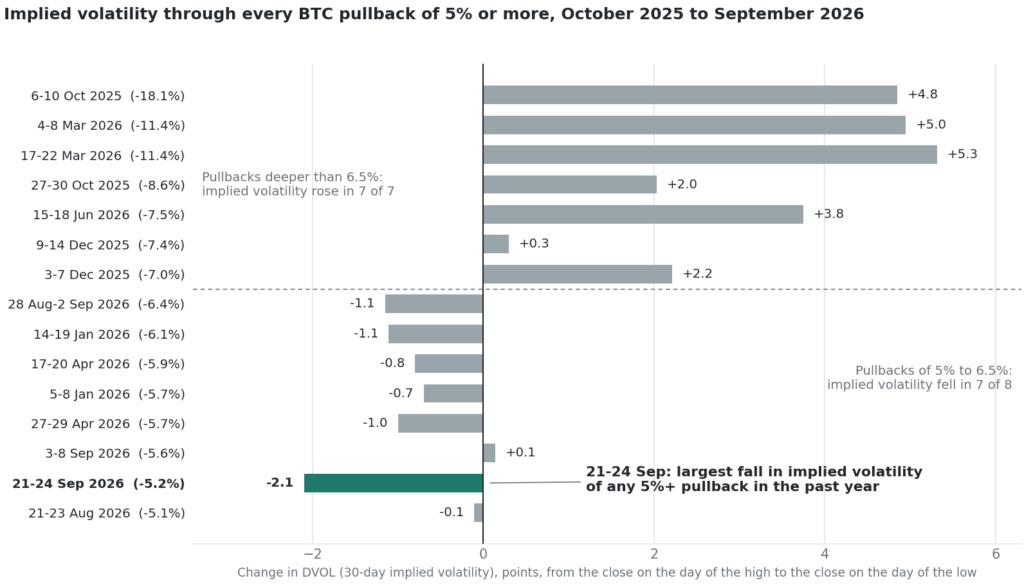
The options market treated the decline as leverage being cleared and OI data above supports that reading. The same interpretation was valid for the second leg lower: BTC reached $82,491 on 28 September and the 30-day Implied Volatility Index closed at 35.1 a day later. This was still lower than 95 percent of the past year’s closes and below the 40.9 percent that bitcoin actually realised over the past 30 days.
With IV this low, protection through Friday’s forthcoming payrolls report is unusually cheap to hold, so a move in either direction is more likely to be met by hedging flow than by forced selling. This suggests downside moves are likely to remain contained into the weekly close, unless positioning changes materially.
What We Expect, and What Traders Should Watch
Our view remains constructive while bitcoin holds above $81,300. Our base case is that price builds on the new cost basis between $82,500 and $84,000 through Friday’s payrolls, with $84,000 to $86,500 capping advances until ETF absorption recovers. If inflows return to five times issuance, we expect demand to absorb selling pressure from the overhead band and for bitcoin to test the $87,722 yearly open. Beyond that, the $95,000 to $96,700 area is the October objective implied by both seasonality and options positioning.
What would change our view is sustained trading below $81,300 paired with ETF outflows, since that would put the ETF cohort into loss and bring the $77,000 True Market Mean into view.
| Signal | Reading now | What it tells traders |
|---|---|---|
| ETF absorption (AER) | 1.8 times issuance on 29 September | Above five times (about $190 million a day) supports a reclaim of $84,000; a first outflow day after nine inflows is the early warning |
| Cost-basis band at $82,500 to $84,000 | 306,000 BTC, from 110,000 BTC on 27 September | Continued growth means spot buyers are absorbing supply; a loss of $82,500 leaves thin support to $81,500 |
| $81,300 and $81,722 | Former range top and ETF holder breakeven | Holding here keeps both buying cohorts in profit; sustained trading below brings $77,000 into view |
| October implied volatility | 35.2 percent; October straddle 7.8 percent | Options price half the median October move, so protection and upside exposure are both inexpensive by this year’s standards |

The post Bitcoin Enters Q4 Needing Stronger Spot Demand appeared first on Bitfinex blog.
Read MoreBy: Javier Bastardo
Title: Bitcoin Enters Q4 Needing Stronger Spot Demand
Sourced From: blog.bitfinex.com/bitfinex-alpha/bitcoin-needs-stronger-spot-demand-q4/
Published Date: Wed, 30 Sep 2026 14:31:49 +0000
----------------------------
Did you miss our previous article...
https://trendingincrypto.com/crypto-news/citi-and-coinbase-automate-stablecointofiat-conversion-for-institutional-clients