.png)
Bitcoin (BTC) is stalling below the $76,000 zone in mid-April 2026, as on-chain data shows exchange inflows surging to multi-month highs. This development occurs as the BTC price hovers around $75,600, down slightly by about 0.4% in 24 hours but still up over 3% for the week. The surge in Bitcoin transfers to exchanges coincides with the price approaching this key resistance, suggesting the building short-term selling pressure.
Bitcoin Struggles Below Key Resistance
BTC Price Chart (1D). Source: TradingView
Currently, Bitcoin is testing the $76,000 resistance level—a price point that has repeatedly rejected upward momentum over the last two months. After a deep drop to the $60,000 zone in early February, BTC recovered and established a short-term bullish structure with higher lows.
However, this upward momentum is showing signs of weakening as the price is continuously rejected around the $75,000–$76,000 range. The current trading range is narrowing between the overhead resistance and support around $70,000–$72,000, indicating the market is entering a price compression phase.
In this context, the lack of momentum to break through resistance leaves the market vulnerable to cash flow factors, especially since the market has not yet shown a signal strong enough for a breakout.
Exchange Inflows Signal Rising Sell Pressure
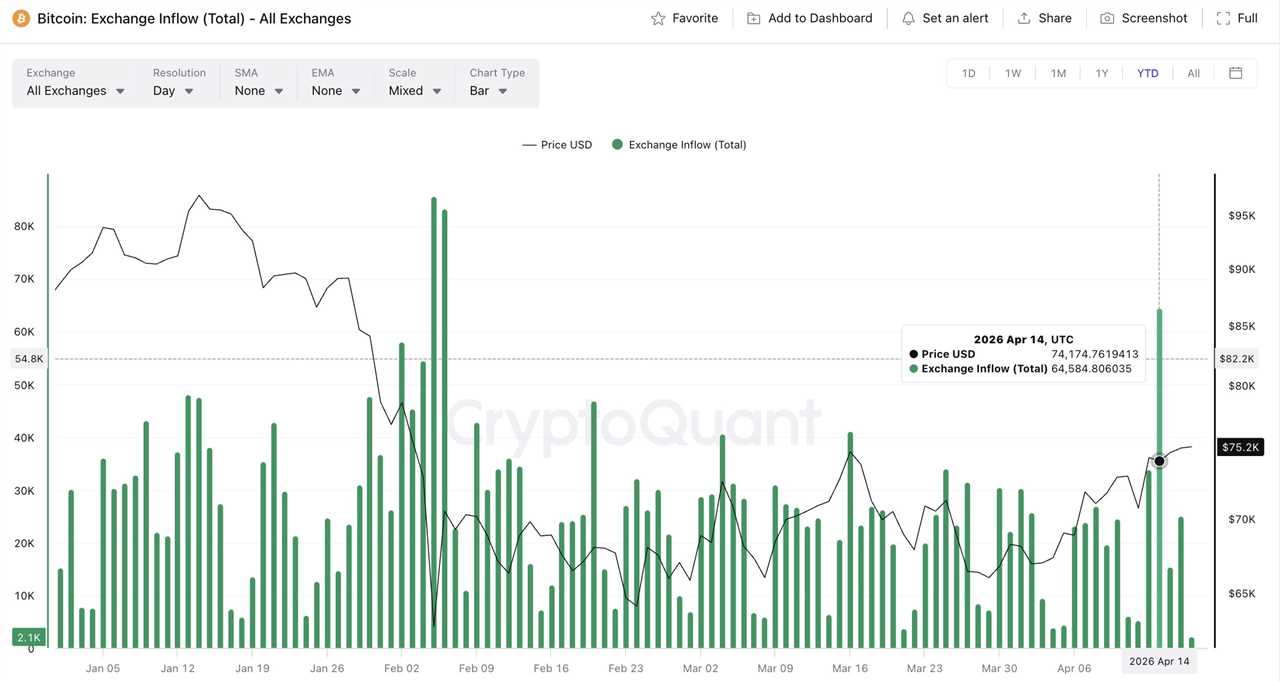
Bitcoin Exchange Inflow (Total). Source: CryptoQuant
Data from CryptoQuant shows that the amount of Bitcoin transferred to exchanges has increased sharply in recent days, with a peak on April 14 when inflows exceeded approximately 64,000 BTC—the highest level since early February.
Assets being moved to exchanges are often associated with the intent to sell or reallocate portfolios, particularly when occurring at high price levels. Simultaneously, recent inflow spikes have appeared with higher frequency, suggesting that capital is reacting more sensitively to market rallies.
Bitcoin hit $76K resistance, and exchange inflows surged.
~11K BTC/hour moved to exchanges, the highest since Dec 2025 and above the March spike that preceded a pullback.
Large holders are positioning to distribute into strength. Watch for selling pressure. pic.twitter.com/zcTHglIVnL
— CryptoQuant.com (@cryptoquant_com) April 15, 2026
This development is further supported by CryptoQuant data, showing hourly exchange inflows reaching approximately 11,000 BTC—the highest level since December 2025 and higher than the spikes seen before the corrections in March.
Meanwhile, netflow data since the beginning of 2026 still shows an overall outflow from exchanges, reflecting a long-term accumulation trend, even though short-term inflows are increasing around high price zones.
Whale Inflows Add to Distribution Concerns
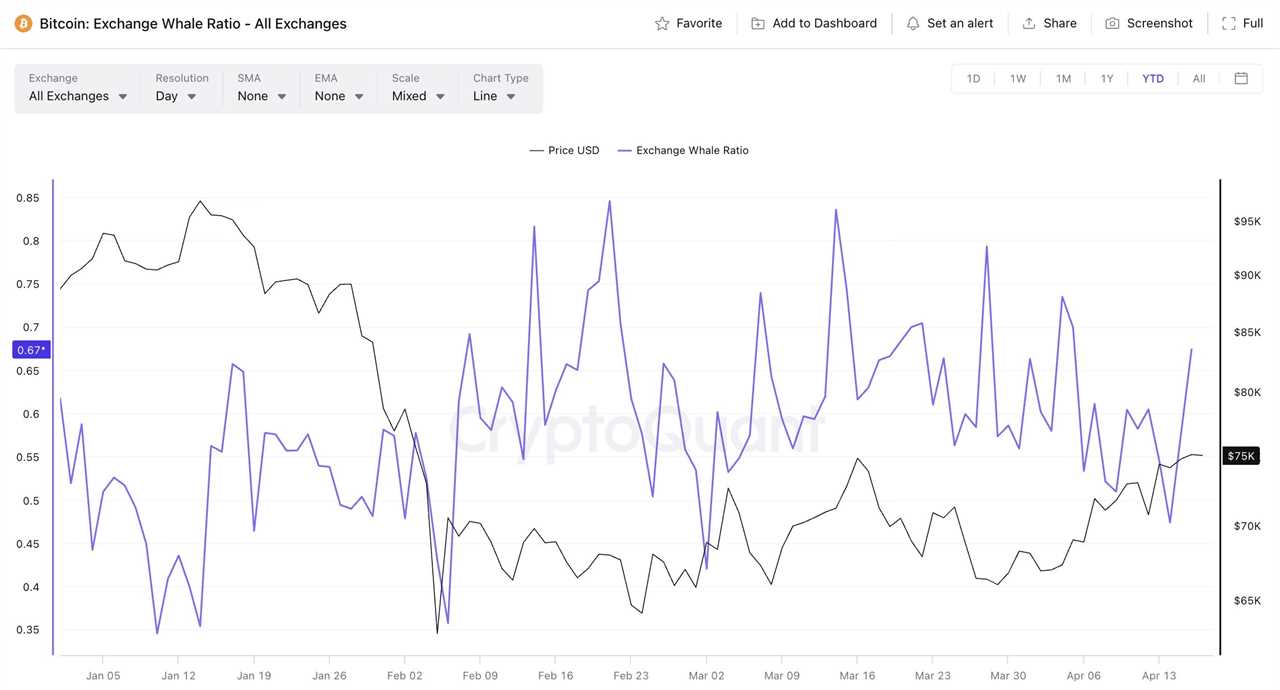
The Exchange Whale Ratio—an indicator measuring the proportion of large transactions in the total Bitcoin inflow to exchanges—has remained high in recent sessions, reflecting that large transactions account for a significant portion of total inflows.
This indicates that the capital moving onto exchanges is not coming from retail investors, but primarily from large wallets—typically represented by “whales” or long-term holders.
In previous cycles, an increase in whale inflows often coincided with local price peaks, as large holders utilized liquidity to distribute assets. The fact that this indicator is rising alongside total inflows reinforces the possibility that the market is facing active selling pressure rather than just a short-term reaction.
Additional Signals Show Mixed Market Positioning
With Bitcoin at a resistance zone and exchange inflows increasing, indicators from the derivatives market show a divergence in investor positioning.
Funding rates on futures exchanges have remained negative for the past 7 consecutive days, reflecting that most traders are leaning toward short positions. Simultaneously, Open Interest (OI) is trending back up toward approximately $26 billion, indicating that new positions are being opened rather than closed.
The combination of negative funding and rising OI typically reflects a buildup of short positions, which could become a trigger for volatility if the price moves against market expectations.
Furthermore, capital flows from ETFs also show divergence. Some recent sessions have recorded significant outflows, though a prolonged trend of withdrawals has not yet formed.
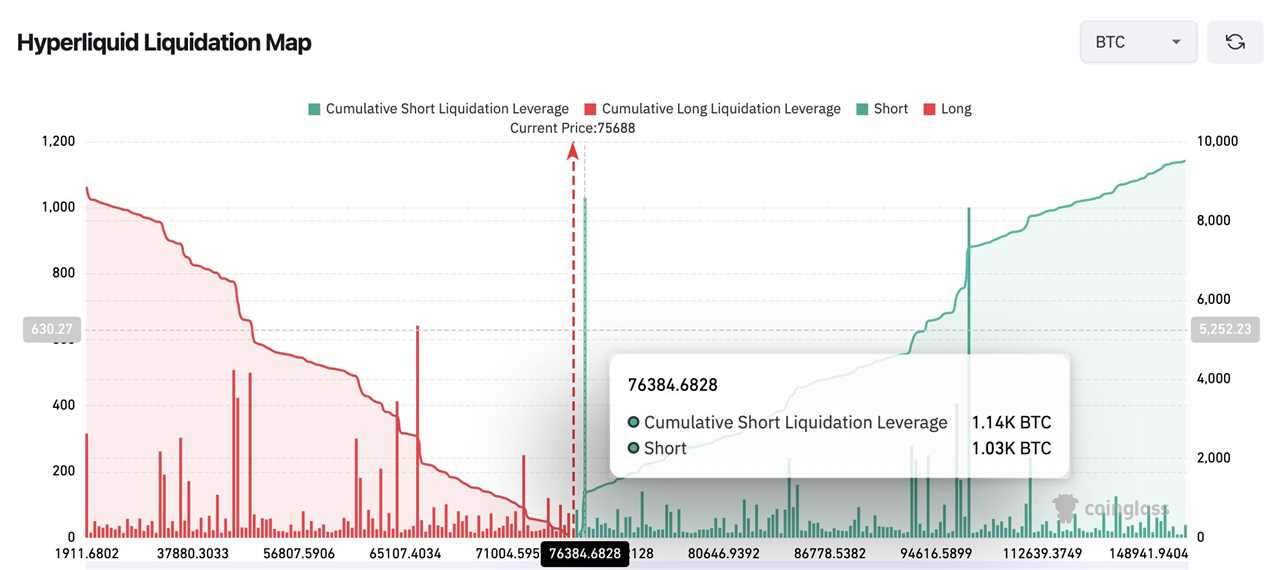
Hyperliquid Liquidation Map. Source: Coinglass
Meanwhile, liquidation maps show large liquidity clusters concentrated around the $76,300 zone, primarily consisting of short positions—areas that could act as liquidity magnets in the short term.
Market at a Short-Term Inflection Point
Bitcoin is facing a critical test at the $76,000 zone as selling pressure begins to mount.
The sharp increase in exchange inflows—especially from large holders—suggests a distribution risk as the price approaches this resistance level. Meanwhile, derivatives market metrics show that short positions are increasing, opening the possibility for high volatility if the market moves against expectations.
A failure to overcome the $76,000 zone could lead to a correction back to the $70,000 area or lower. Conversely, if Bitcoin breaks resistance with high volume, the market could quickly shift into an acceleration phase as short positions are liquidated.
At the moment, Bitcoin’s next direction will likely be decided right at the $76,000 price level, as both selling pressure and speculative positions increase.
The post Bitcoin Faces $76K Resistance as Exchange Inflows Surge to Multi-Month Highs appeared first on NFT Evening.
Read MoreBy: NFTevening
Title: Bitcoin Faces $76K Resistance as Exchange Inflows Surge to Multi-Month Highs
Sourced From: nftevening.com/bitcoin-resistance-exchange-inflows-multi-month-highs/?utm_source=rss&utm_medium=rss&utm_campaign=bitcoin-resistance-exchange-inflows-multi-month-highs
Published Date: Fri, 17 Apr 2026 14:24:34 +0000
----------------------------