.png)
PRICE ACTION: THE GAMMA FLOOR IS CLEARED
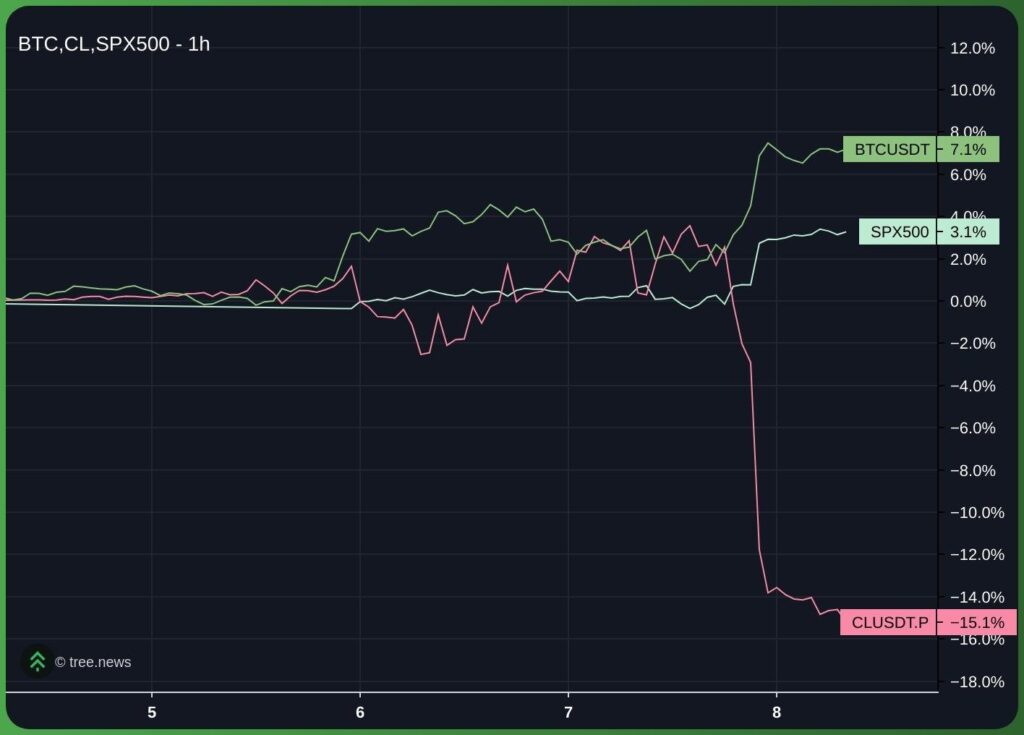
Bitcoin opened the week at approximately $66,941, staying above the ‘bear activation threshold’ we identified, at $65,499. With the announcement of a temporary cease fire in the Middle East, BTC rose to $72,789 in early trading on 8 April. This constitutes a $7,851 rebound from the current low, a 12 percent move, and taking the price straight through the $68,000 negative gamma floor we identified in this week’s Bitfinex Alpha.
The $68,000 level is mechanically significant. Below it, dealers carrying net short gamma positions are systematically obligated to sell spot as price declines, creating a self-reinforcing feedback loop (as seen during the 3 April long liquidation cascade, which produced $247 million in liquidations in a single session). Above $68,000, that mechanic reverses: dealers are compelled to buy as price ascends to maintain delta neutrality. The current recovery carries the signature of a gamma-assisted squeeze, not purely organic demand.
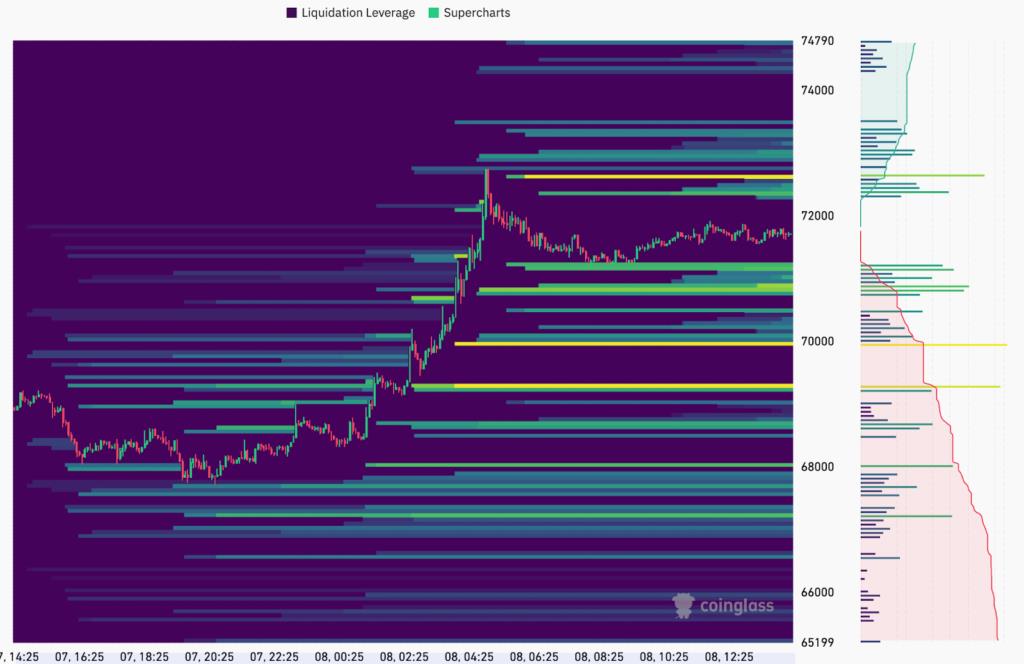
The key question for the rest of the week is whether this recovery represents genuine acceptance above $68,000 or a temporary overshoot that fails on a retest. Structural acceptance requires three consecutive daily closes above the threshold; two have been confirmed as of writing. The nearest mechanical resistance sits at the $71,800–$72,000 short liquidation cluster. A decisive move above $72,000, confirmed by volume, would signal that the prevailing gamma environment has shifted from amplifying declines to accelerating recoveries.
ETF FLOWS: RECORD INFLOW, CONTESTED REVERSAL
The ETF flow data this week contains both the strongest single-session inflow signal in recent months and an immediate partial reversal. Monday, 6 April, recorded a combined net inflow of $471.4 million. The composition was institutionally significant: BlackRock’s IBIT led with $181.9 million, Fidelity’s FBTC contributed $147.3 million, and ARK Invest’s ARKB added $118.8 million. This is coordinated accumulation across the three largest vehicles, not a tail-end rebalancing artefact.
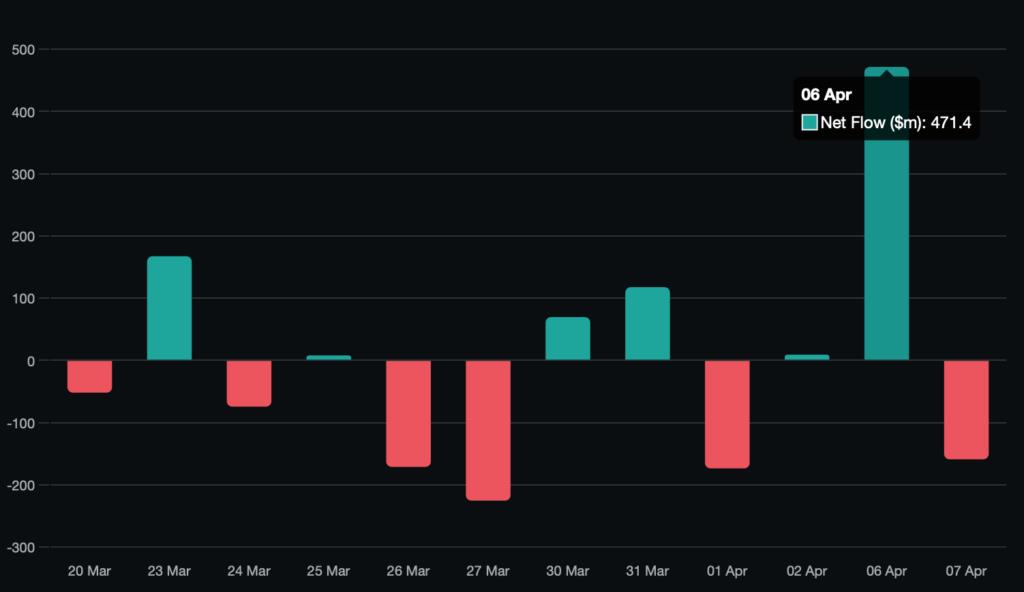
The $471.4 million session marks the strongest single-day institutional bid in over 30 days. It supports the core thesis: US allocators are actively treating sub-$70,000 prices as an accumulation zone. Furthermore, this aggressive buying precedes an expected de-escalation of the ongoing conflict, with Bitcoin exhibiting notable relative strength across mid-timeframes.
Our read is that institutional allocators tactically used the 3–4 April liquidation cascade, initially triggered by the S&P 500’s 8 percent decline following non-farm payroll (NFP) data, and aided by negative gamma mechanics below $68,000, as a pre-planned entry point. The $471.4 million inflow, measured against the prior week’s outflow pattern, confirms this was deliberate positioning.
Tuesday, 7 April, partially offset that signal with a combined outflow of $159.1 million across several funds: IBIT (-$17.1M), FBTC (-$47.8M), ARKB (-$34.2M), VanEck HODL (-$20.4M), and Grayscale GBTC (-$41.9M). The net two-session flow remains positive at +$312.3 million. The reversal doesn’t invalidate Monday’s signal, but it rules out classifying this as a sustained accumulation regime. The pattern, a large single-session inflow followed by a smaller multi-fund outflow, is more consistent with tactical dip-buying than a new structural demand layer. A further positive session exceeding $150 million would shift our reading towards a regime change.
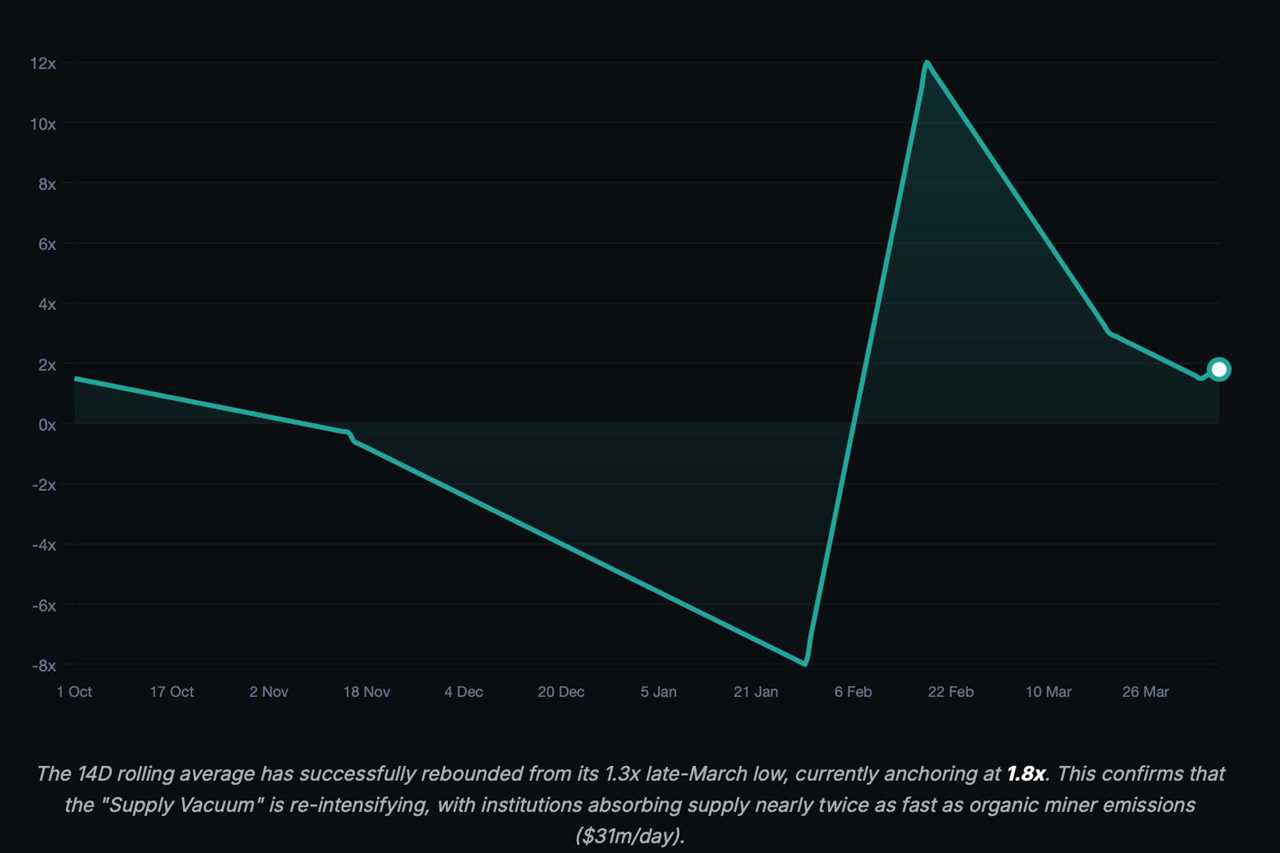
The Bitfinex Absorption-to-Emission Ratio (AER) stands at 1.8x on the 14-day rolling average, up from 1.3x at the end of March.
14D Rolling AER
At 1.8x, institutions are absorbing bitcoin at approximately 1.8 times the rate of organic miner emission ($31 million per day). That places it within the passive absorption band (1x–3x): demand is present and outpacing supply creation, but well short of the overheated institutional conviction level above 3x that characterised the February 2025 rally phase. Read this as a floor stabilisation signal, not a demand acceleration signal.
ON-CHAIN; MVRV AT 0.60: THREE-YEAR VALUE EXTREME
Two on-chain readings shift the structural picture constructively.
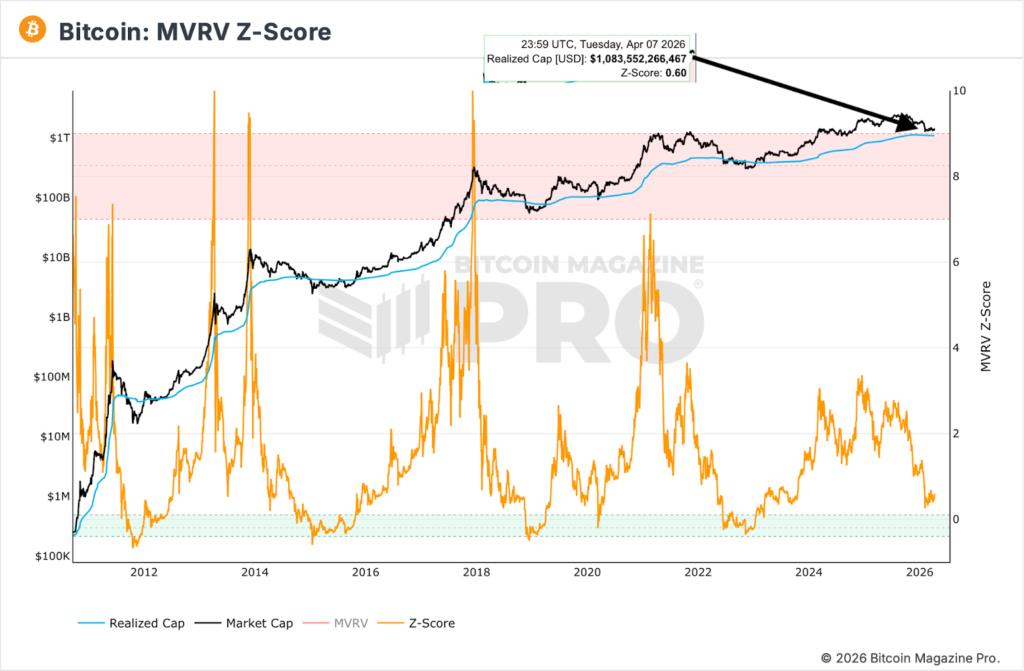
The Market Value to Realised Value (MVRV) Z-Score stands at 0.60 as of 7 April 2026, against a realised market cap of $1,088,382,463,723 The prior confirmed reading was approximately 1.2 as of 11 March. The decline from 1.2 to 0.60 over four weeks reflects the price compression from the mid-March range to the $64,938 low: market capitalisation has converged towards realised cap as unrealised profit across the network has been extinguished. At 0.60, the MVRV Z-Score is approaching the orange-to-green transition on the historical scale. In prior cycles, sustained readings below 0.5 have marked primary market bottoms; readings between 0.5 and 1.0 have defined accumulation phases preceding the next structural advance. This is a value proximity indicator, not a bottom confirmation. Distribution risk is minimal at this level; the risk is duration, not magnitude.
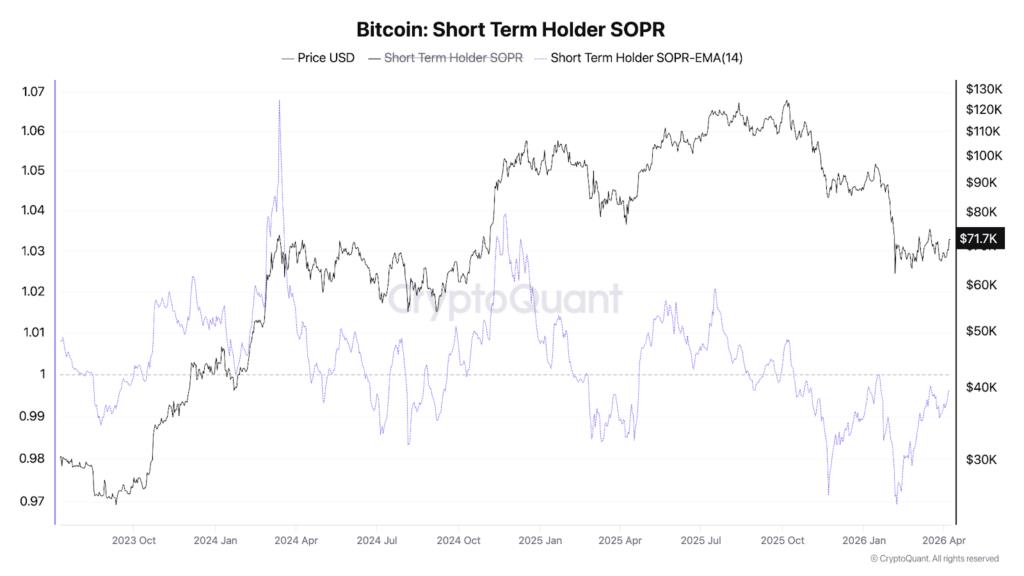
The Short-Term Holder Spent Output Profit Ratio (STH-SOPR) is registering below 1.0, approximately in the 0.97–0.99 range, with BTC price confirmed at approximately $71,700 at the time the chart was captured. An STH-SOPR below 1.0 means that short-term holders, those who acquired bitcoin within the prior 155 days, are on average realising losses at the point of transaction. This is a classic capitulation signature: the 2025 entrant cohort is selling positions at breakeven or below, transferring supply to stronger hands. In prior instances where STH-SOPR sustained sub-1.0 readings whilst price held above a structural support level (here, the $64,938 low), the sequence resolved with a local bottom and recovery. The signal is consistent with a structural low, but doesn’t independently confirm one.
Taken together, MVRV 0.60 and STH-SOPR sub-1.0 constitute the strongest concurrent on-chain value signals since Q3 2023. The on-chain picture has materially shifted from the 6 April reading. The bear case now requires a macro catalyst to override these structural signals.
MACRO: THE HORMUZ PREMIUM UNWINDS
The most significant macro development since the 6 April report is the Trump-Iran two-week ceasefire announced on the evening of 7 April 2026. President Trump suspended planned strikes on Iranian infrastructure fewer than two hours before his stated 8 pm ET deadline, following a 10-point proposal from Iran accepted as a workable basis for negotiations. The condition: Iran commits to a complete, immediate, and safe opening of the Strait of Hormuz.
The market response was immediate and severe in commodity markets. West Texas Intermediate (WTI) crude fell more than 16 percent to $94.47 per barrel; Brent crude declined 15 percent to $92.21. The Strait of Hormuz had been functionally closed since the US-Israel strike on Iranian infrastructure on 28 February 2026, the largest disruption to crude supplies in recorded history, removing approximately 20 percent of global oil supply from transit. The ceasefire announcement partially unwinds the Hormuz supply premium embedded in oil prices since late February.
The macro implications for bitcoin are direct. The 6 April report identified the oil-driven inflation ceiling as the primary constraint on Federal Reserve (Fed) rate-cut optionality: elevated energy costs extended the period before the Fed could ease, keeping real yields elevated and compressing speculative asset multiples. A 15–16 percent collapse in crude, if sustained, materially brings forward the potential cut window. Futures markets will likely reprice additional rate-cut probability for late 2026, which is a structural tailwind for non-yielding risk assets including bitcoin.
The critical qualification: this is a two-week ceasefire, not a resolution. It expires on approximately 21 April. If negotiations fail and the Strait closure resumes, oil will re-spike, potentially above the pre-ceasefire $113–$120 level on a relief-trade reversal, and the Fed cut repricing would unwind. This creates a known binary event approximately 13 days out. Participants holding risk exposure are working within a two-week window. The oil move has been priced; a ceasefire collapse would be incrementally more damaging than the original shock.
The PCE print is the next scheduled macro catalyst. A below-consensus reading would compound the oil deflation signal and accelerate rate-cut repricing. An above-consensus reading would dilute the ceasefire tailwind.
The post The Oil Correction, The Ceasefire, And What It Means For Bitcoin appeared first on Bitfinex blog.
Read MoreBy: Javier Bastardo
Title: The Oil Correction, The Ceasefire, And What It Means For Bitcoin
Sourced From: blog.bitfinex.com/bitfinex-alpha/oil-decline-ceasefire-what-it-means-for-bitcoin/
Published Date: Wed, 08 Apr 2026 11:11:15 +0000
----------------------------
Did you miss our previous article...
https://trendingincrypto.com/crypto-news/demand-for-crypto-pay-surges-but-payroll-systems-fall-behind-research